UX Audit Framework · CHAPTER 5 OF 6

Drawing insights and improving the design

Draw Audit Insights

Step 5

Turn Audit Points Into Defined Problems.

Once the audit is complete, the team should have a clear set of:

​

  • Problems to solve
  • Areas to improve
  • Good patterns to retain
  • Ideas to explore

​

This gives direction for the solution phase.

Illustration accompanying Turn Audit Points Into Defined Problems.

Turn Audit Points Into Defined Problems.

Once the audit is complete, the team should have a clear set of:

  • Problems to solve
  • Areas to improve
  • Good patterns to retain
  • Ideas to explore

This gives direction for the solution phase.

Illustration accompanying Turn Audit Points Into Defined Problems.
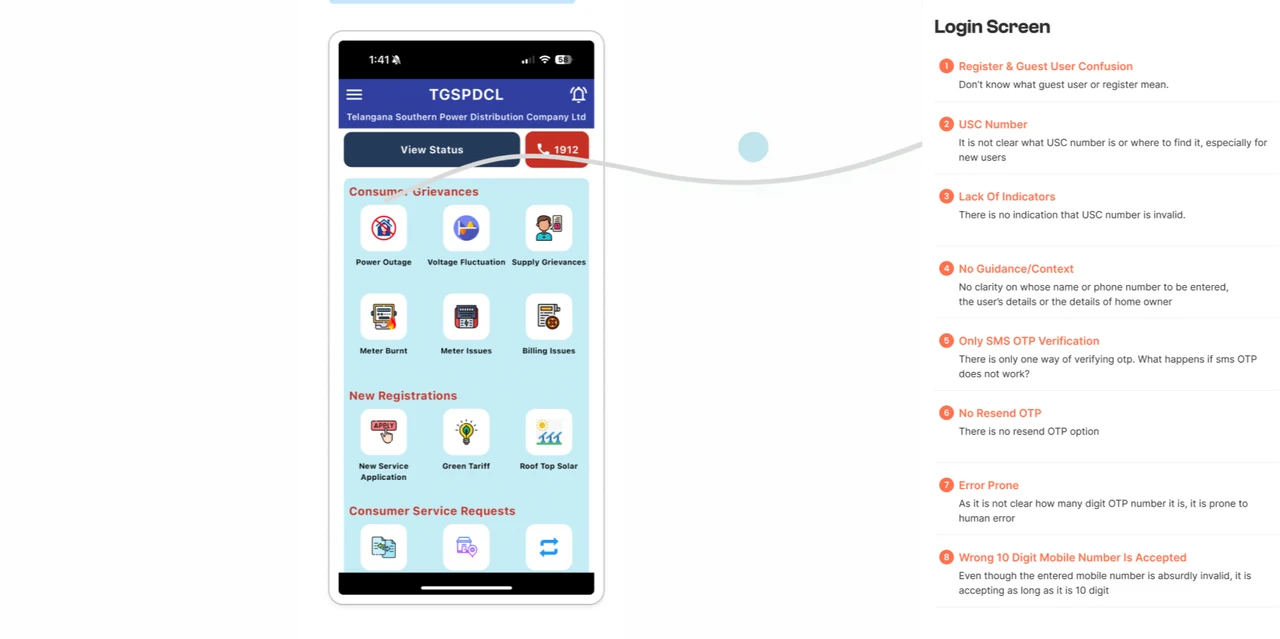
Capture Measurable Audit Data.: Total number of screens Number of clicks or steps Repeated actions Decision points Possibilities of human error Average task completion time

Total number of screens

Capture Measurable Audit Data.: Total number of screens Number of clicks or steps Repeated actions Decision points Possibilities of human error Average task completion time

Number of clicks or steps

Capture Measurable Audit Data.: Total number of screens Number of clicks or steps Repeated actions Decision points Possibilities of human error Average task completion time

Repeated actions

Capture Measurable Audit Data.: Total number of screens Number of clicks or steps Repeated actions Decision points Possibilities of human error Average task completion time

Decision points

Capture Measurable Audit Data.: Total number of screens Number of clicks or steps Repeated actions Decision points Possibilities of human error Average task completion time

Possibilities of human error

Capture Measurable Audit Data.: Total number of screens Number of clicks or steps Repeated actions Decision points Possibilities of human error Average task completion time

Average task completion time

You can also use usability heuristics to check:

Capture Measurable Audit Data.

These insights help identify optimisation opportunities.

Capture Measurable Audit Data.

These insights help identify optimisation opportunities.

Total number of screens

Number of clicks or steps

Repeated actions

Decision points

Possibilities of human error

Average task completion time

You can also use usability heuristics to check:

Measure the Impact After Redesign.

Once the workflow is redesigned, compare it with the original audit baseline.

​

This helps show the actual impact of design decisions.

Illustration accompanying Measure the Impact After Redesign.

Measure the Impact After Redesign.

Once the workflow is redesigned, compare it with the original audit baseline.

This helps show the actual impact of design decisions.

Illustration accompanying Measure the Impact After Redesign.

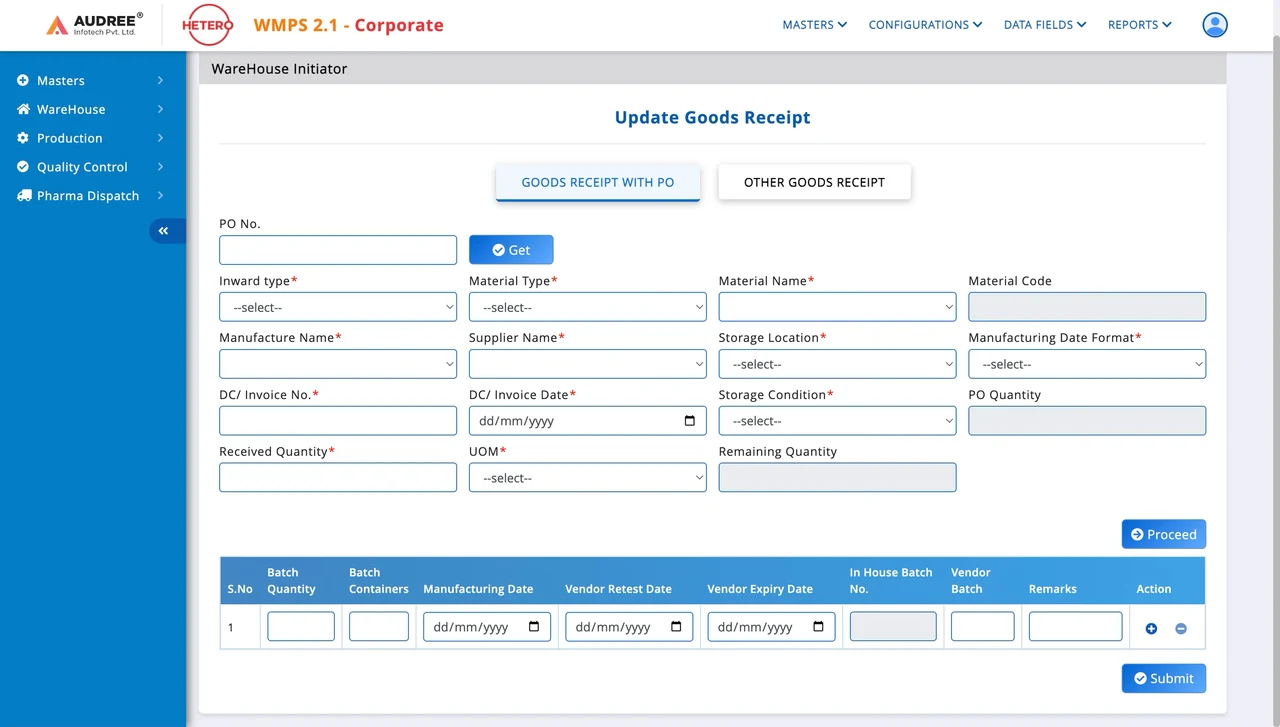
Example:

A BMR software originally had 4,650 screens.

​

After redesign, it was reduced to 780 screens by solving workflow problems and making the experience more efficient.

Reduced

7650 Screens

780 Screens

Before

Example:: Reduced 7650 Screens 780 Screens Before After Batch No NAV880001001 Product Name Abacavir sulfate Product Code RML005 Stage * AB Requests details Request Number MIN24060001-001 Requested Location Block-A Requested Date 02/04/2024 80 Coupled

After

Batch No

Product Name

Product Code

Stage

*

AB

Requests details

Request Number

Requested Location

Requested Date

80

Coupled Ester ( RML005 )

Requested Qty: 100 Kg’s

140

Sodium starch glycolate ( RML345 )

Fully Received

140

Sodium starch glycolate ( RML345 )

Fully Received

140

Sodium starch glycolate ( RML345 )

Fully Received

140

Sodium starch glycolate ( RML345 )

Fully Received

140

Sodium starch glycolate ( RML345 )

Fully Received

140

Sodium starch glycolate ( RML345 )

Fully Received

Materials 10

Goods Issue Details

Coupled Ester ( RML005 )

Manufacturer Name

Available Qty.

Requested Qty.

Batch No.

Issued Qty.

Balance Qty.

WD ID/Diprod ID

Comments

Hetero Drugs Limited

10.000

KG

10.000

KG

Select

10.000

KG

10.000

KG

Enter WD ID

Comments

Please review and let me know if there any changes

Add your comments

Submit

1

HA

Harish A

WH Initiator

800012

Change Password

Display scale

Configurations

Data Fields

Reports

Example:: Reduced 7650 Screens 780 Screens Before After Batch No NAV880001001 Product Name Abacavir sulfate Product Code RML005 Stage * AB Requests details Request Number MIN24060001-001 Requested Location Block-A Requested Date 02/04/2024 80 Coupled

WMPS

Reports

1

HA

Kishor

WH Initiator

800012

Change Password

Display scale

Logout

BMR

Goods Issue

Pending

Reduced

7650 Screens

780 Screens

Example:

A BMR software originally had 4,650 screens.

After redesign, it was reduced to 780 screens by solving workflow problems and making the experience more efficient.

Audit Findings Guide the Solution Phase.

Audit findings become the input for:

Restructured IA, Wireframes, UI Concepts, Final UI Design

​

The solution phase should not start from assumptions. It should start from verified audit findings.

Audit Findings

Audit Findings Guide the Solution Phase.: Audit Findings Restructured IA Wireframes UI Concepts Final UI Design

Restructured IA

Wireframes

UI Concepts

Final UI Design

Audit Findings Guide the Solution Phase.

Audit findings become the input for:

Restructured IA, Wireframes, UI Concepts, Final UI Design

The solution phase should not start from assumptions. It should start from verified audit findings.
Restructured IA

Wireframes

UI Concepts

Final UI Design

Audit Findings

The Big Consequences of Poor Auditing

Poor Audit Creates Expensive Design Debt.

When existing problems are not identified properly, they get carried into the redesign.

​

The new product may look better, but users may still face the same confusion, long workflows, and dependency on support.


Illustration accompanying Poor Audit Creates Expensive Design Debt.

Poor Audit Creates Expensive Design Debt.

When existing problems are not identified properly, they get carried into the redesign.

The new product may look better, but users may still face the same confusion, long workflows, and dependency on support.
Illustration accompanying Poor Audit Creates Expensive Design Debt.

When Audit Is Weak, the Redesign May Lead To:

Wrong priorities

Support dependency

Repeated UX gaps

More rework

Low feature adoption

Broken paths

When Audit Is Weak, the Redesign May Lead To:

Wrong priorities

Support dependency

Repeated UX gaps

More rework

Low feature adoption

Broken paths

It Affects Business Performance.

A Weak Audit Does Not Just Affect Design.

A Weak Audit Does Not Just Affect Design.

It Affects Business Performance.

What Good UX Audit Changes in the Final Design

Good Audit Leads to Focused Redesign Decisions.

Clearer Workflows

Better Discoverability

Fewer Redundant Steps

Stronger Product Feedback

Clearer Actions

Less Rework

This helps create:

With a detailed audit, the team knows what needs to change and why.

Good Audit Leads to Focused Redesign Decisions.

With a detailed audit, the team knows what needs to change and why.

This helps create:

Clearer Workflows

Better Discoverability

Fewer Redundant Steps

Stronger Product Feedback

Clearer Actions

Less Rework

Audit Findings Give the Redesign a Clear Direction.

Audit findings give the team a clear understanding of existing friction.

​

Wireframes and UI decisions can then focus on solving verified product problems instead of redesigning based on assumptions.


Wrong

Correct

Audit Findings Give the Redesign a Clear Direction.: Wrong Correct

Audit Findings Give the Redesign a Clear Direction.

Audit findings give the team a clear understanding of existing friction.

Wireframes and UI decisions can then focus on solving verified product problems instead of redesigning based on assumptions.

Wrong

Correct

Audit Findings Give the Redesign a Clear Direction.: Wrong Correct

FRAMEWORK CONTENTS

UX Audit Framework

Search documentation

Search scope

Search across all eight guides.

Diagram detail